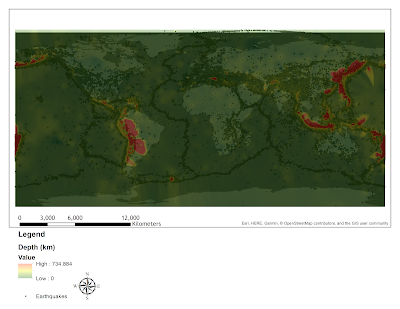
I decided to go back to the NCEDC to get some data. I did a search and set the lower limit for magnitude to 3, no limits for depth or long/lat. I limited it to nothing before 1970 because some of the data such as depth or magnitude were missing before then. I asked to to return it to me in "csv format" (which still comes as a webpage). Then I set the line limit to 1,000,000. I wanted all the data points I could get. And I got them. All 583,000 or so points. I initially asked for 50,000, and got those too, but they weren't enough. Each point comes with long/lat, magnitude, depth, data, and more that I am not concerned with. Turns out the 583,000 entry .csv is ~46 mb as a .csv or .txt. If I convert it to points in ArcGIS the .dbf (database file) is 500+ mb alone. Damn.
To find the answer to my question I did two things. First, I played with some Python to let it to the stats on the magnitude and depth to find the correlation. Python suggests that no, they aren't correlated. You can see the iPython Jupyter Notebook I created for it here. Gotta love Python.
Earthquakes 1970-1978:
Depth standard dev: 1.708
Depth variance: 2.917
Magnitude standard dev: 2.882
Magnitude variance: 8.306
depth vs. magnitude correlation:
[[ 1.          0.00593409]
 [ 0.00593409  1.        ]]
The two middle values are the correlation for depth amd magnitude to one another.

Earthquakes 1970-2018:
Depth standard dev: 1.708
Depth variance: 2.918
Magnitude standard dev: 2.872
Magnitude variance: 8.248
depth vs. magnitude correlation:
[[ 1.          0.00236923]
 [ 0.00236923  1.        ]]
The two middle values are the correlation for depth amd magnitude to one another.
For the bit in brackets, the important number are the middle two. They are the calculated correlation values between depth and magnitude. Python's Numpy library displays it that way. I would write a function to do the same thing and output in a nice format, but why re-invent the wheel?
Secondly, while number are all fine and good, it might be nice to see this a little more visually. This is where the interpolation comes in. As I had over 500,000 points, covering the whole globe, we can get a good picture of both the depth and magnitude of earthquake across the whole planet. I went with IDW interpolation as Kriging 500,000+ points makes Arc lose its mind. Running the Kriging interpolation never finished.
I am forced to conclude that there appears to be little mathematical evidence for a correlation between earthquake magnitude and depth as well as the more qualitative representation on a map. The map, however, shows an interesting pattern that the smaller earthquakes are concentrated in Europe, North America, and Australia. I don't fully know why as of yet.

